Everything you need to know about TINT Attention Score
In the digital economy, attention is the scarcest resource. Long are the days of gazing at your content, thinking it’s good, thinking that people will pay attention, but not actually knowing until it is published. There’s a new sheriff in this marketing town, a first-of-its-kind pre-planning content feature in our platform that allows you to look behind the eyes of your buyer to visualize how your content will be perceived before you publish. So, let’s all give a big warm welcome and find out all about this powerful new functionality in the TINT platform.
Visualize and observe Attention Scores BEFORE you post
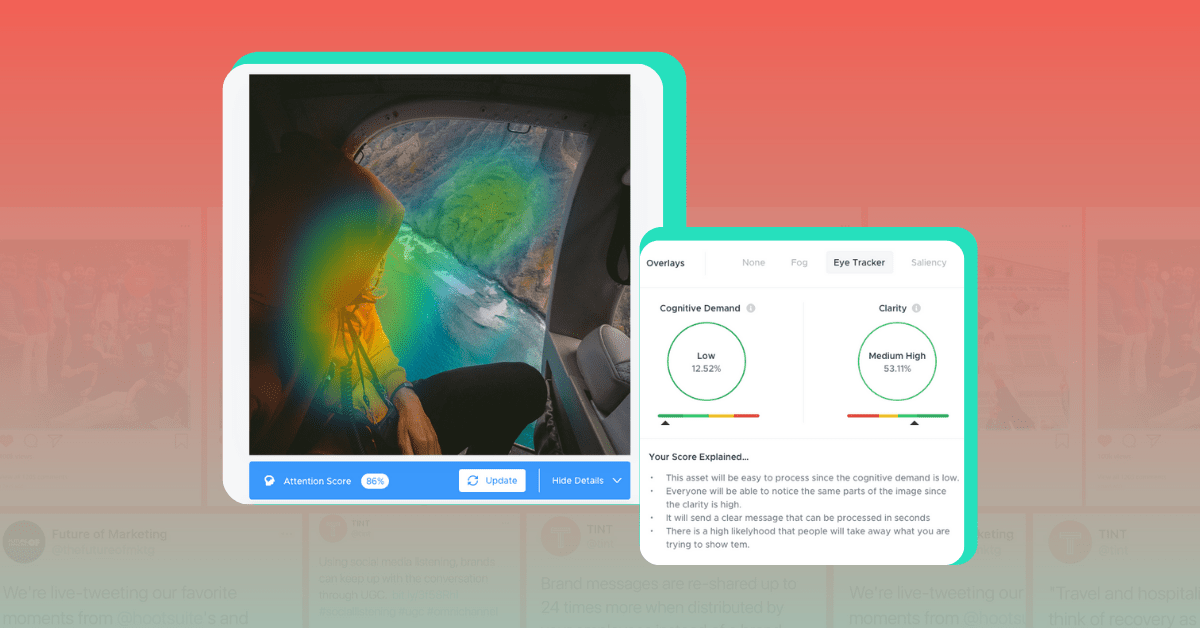
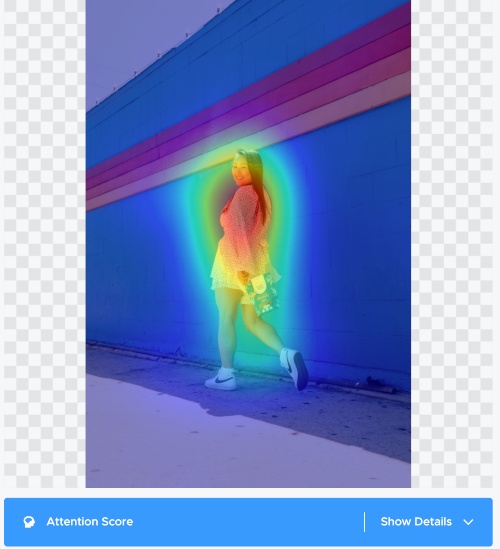
Visual assets in your UGC Studio library can be scanned using our Eye Tracker technology where AI analyzes your visual content instantly to create a heat map, predictively highlighting areas that will catch the attention of the user.

The TINT Attention Score Artificial Intelligence (AI) model is built on extensive neuroscience research and trained on one of the industry’s largest eye-tracking databases to accurately predict behavior and visual attention which in turn influence the decision making and buying behaviors of your audience.
Ready to get started? Click here.
Gain a comprehensive understanding of why your content will or will not convert with Cognitive Demand and Clarity Scores
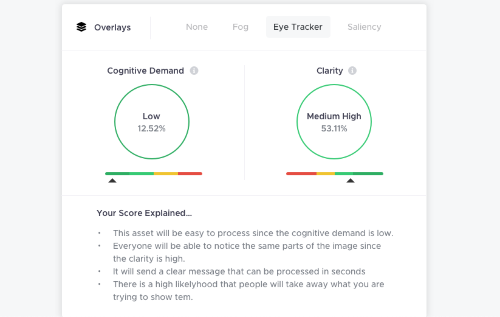
The makeup of visual content, placement of images, logos, and text can all influence the decision-making process through visual attention. Beyond the heat map, TINT Attention Score gives you an in-depth analysis of your content including cognitive load and clarity.
Let’s break down what Cognitive Demand and Clarity scores mean when analyzing your content for attention-grabbing details.
Cognitive Demand scores the level of time and difficulty it takes the user to understand your content. A low score indicates that a user can process the content within a few seconds. This is good! The lower the better when it comes to cognitive demand. A high score means users will spend much more time processing the content. Hard to comprehend imagery can cause the viewer to ignore or simply scroll on without engaging, and we don’t want that!
Moving on to the Clarity score, this is based on how visible the key areas of your content are. If key areas of the content are hard to see, clarity for the user will be low. If multiple areas of the content draw attention in a clear way, the score will be higher.
Talk to a TINT Customer Success Specialist
Attention is a scarce resource and research has found that less than one third of ads get the full attention of an audience. Visual content that gets attention is essential when it comes to strategically planning content campaigns, whether that be on a channel using an organic or paid approach.
Say you are planning a paid ad, set to launch on social media. You’ll want to be sure the content is achieving the expected engagement for a campaign within a set budget and goal. An ad that is not seen is worthless and even with ads that ARE seen, every second counts as the longer people looked at an ad, the bigger the effect on Return on Ad Spend and conversions.
The age-old method of choosing the “right” content is by relying heavily on benchmarking data, competitor research, and a little bit of Marketing gut and what “looks good”. But none of these can guarantee how the content will perform or resonate with the target audience, and before now there hasn’t been a way to gauge the attention grabbing potential of a particular piece of content. Sure, once a campaign is running we can change out images and rearrange text, but at the cost of budget, opportunity, and time wasted.
The role of visual attention in the interaction between the environment and the mind and its influence on the consumer cannot be overstated. As you can already see, choosing the right visual content to publish across channels and campaigns is a daunting task, and to be realistic, sometimes scary. TINT’s Attention Score allows us marketers to be able to look behind the eyes of our user, learn what will grab attention, and use the instant results to test and optimize visual creative BEFORE publishing to maximize attention and drive the desired behaviors.

